> ## Documentation Index
> Fetch the complete documentation index at: https://help.mercury360.com/llms.txt
> Use this file to discover all available pages before exploring further.
# Job Reports
> Track job progress, spot delays, and compare hiring performance across departments.
Job Reports answer the question: **Which jobs are progressing, and which need attention?** Use them to track timelines, distribution, and hiring success.
## When to use this report
Use Job Reports when you need to:
* Check whether jobs are being **filled on time**
* Identify jobs that are **delayed or stuck**
* Compare hiring performance **across departments**
## Open Job Reports
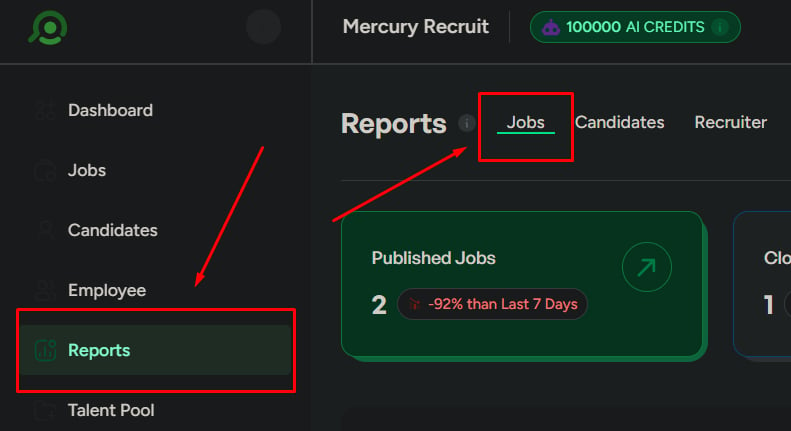
Click **Reports** in the left menu.
Stay on the default **Jobs** tab.
 ## Report sections
Understand job status distribution and overall workload.
Track new candidates and where volume is coming from.
Review top candidates and score changes across stages.
Monitor completion rate and department-level performance.
## Job status overview
Shows the distribution of jobs across statuses:
* Published
* Closed
* Draft
* Archived
- Tracking how many jobs are active vs closed
- Reviewing overall hiring workload
* **Too many drafts** — jobs not ready or stalled
* **Too many closed without hires** — jobs closing without success
## Newly added candidates
Shows recently added or applied candidates so you can track incoming flow.
When checking if jobs are attracting candidates.
Low new candidates — indicates poor job visibility or a sourcing issue.
Review job visibility, check sourcing channels, and refine the job description.
## Candidates by department
Shows candidate volume grouped by department—useful for hiring planning.
| Signal | Action |
| ------------------------------- | -------------------------------------------------------------- |
| **Many open roles, low volume** | Increase sourcing for that department and review requirements. |
## Top candidates by job
Shows the **top 10 ranked candidates** for a selected job. Use it when shortlisting.
**Low-quality top candidates** can indicate a weak applicant pool. Prioritize outreach to your strongest candidates and move them faster in the pipeline.
## Average score by stage (per job)
Shows average candidate scores at each hiring stage. Use it to evaluate screening quality.
When candidates are not progressing.
Large score drops between stages — a sign of inconsistent evaluation.
Review evaluation criteria and align interviewers on scoring standards.
## Hiring completion rate
The percentage of job openings successfully filled—your headline measure of hiring success.
| Signal | Action |
| ----------------------- | ------------------------------------------------------------------------------- |
| **Low completion rate** | Review pipeline delays, check candidate quality, and reassess job requirements. |
## Jobs by department
Shows the number of openings per department—your hiring distribution at a glance.
## Open vs closed jobs by department
Compares open and closed jobs by team. Use this to spot delays.
Many open but few closed — hiring is delayed in that department.
Identify bottlenecks in hiring stages and reallocate resources to delayed teams.
## Date range
Control the time period for every chart on this page:
* **Last 7 days** — recent activity
* **Last 30 days** — overall trend
* **Custom range** — detailed analysis
Always check the date range before drawing conclusions.
## Report sections
Understand job status distribution and overall workload.
Track new candidates and where volume is coming from.
Review top candidates and score changes across stages.
Monitor completion rate and department-level performance.
## Job status overview
Shows the distribution of jobs across statuses:
* Published
* Closed
* Draft
* Archived
- Tracking how many jobs are active vs closed
- Reviewing overall hiring workload
* **Too many drafts** — jobs not ready or stalled
* **Too many closed without hires** — jobs closing without success
## Newly added candidates
Shows recently added or applied candidates so you can track incoming flow.
When checking if jobs are attracting candidates.
Low new candidates — indicates poor job visibility or a sourcing issue.
Review job visibility, check sourcing channels, and refine the job description.
## Candidates by department
Shows candidate volume grouped by department—useful for hiring planning.
| Signal | Action |
| ------------------------------- | -------------------------------------------------------------- |
| **Many open roles, low volume** | Increase sourcing for that department and review requirements. |
## Top candidates by job
Shows the **top 10 ranked candidates** for a selected job. Use it when shortlisting.
**Low-quality top candidates** can indicate a weak applicant pool. Prioritize outreach to your strongest candidates and move them faster in the pipeline.
## Average score by stage (per job)
Shows average candidate scores at each hiring stage. Use it to evaluate screening quality.
When candidates are not progressing.
Large score drops between stages — a sign of inconsistent evaluation.
Review evaluation criteria and align interviewers on scoring standards.
## Hiring completion rate
The percentage of job openings successfully filled—your headline measure of hiring success.
| Signal | Action |
| ----------------------- | ------------------------------------------------------------------------------- |
| **Low completion rate** | Review pipeline delays, check candidate quality, and reassess job requirements. |
## Jobs by department
Shows the number of openings per department—your hiring distribution at a glance.
## Open vs closed jobs by department
Compares open and closed jobs by team. Use this to spot delays.
Many open but few closed — hiring is delayed in that department.
Identify bottlenecks in hiring stages and reallocate resources to delayed teams.
## Date range
Control the time period for every chart on this page:
* **Last 7 days** — recent activity
* **Last 30 days** — overall trend
* **Custom range** — detailed analysis
Always check the date range before drawing conclusions.
 ## Export reports
Export as **CSV**, **PDF**, or **XLSX**. Select a specific report or export all sections—keep exports focused.
## Export reports
Export as **CSV**, **PDF**, or **XLSX**. Select a specific report or export all sections—keep exports focused.
 ## Related
Find where candidates drop off in the pipeline.
Compare recruiter contribution and efficiency.
## Related
Find where candidates drop off in the pipeline.
Compare recruiter contribution and efficiency.