> ## Documentation Index
> Fetch the complete documentation index at: https://help.mercury360.com/llms.txt
> Use this file to discover all available pages before exploring further.
# Reports Overview
> Use reports to track hiring progress, spot bottlenecks, and compare performance across jobs, candidates, and recruiters.
Reports turn raw hiring activity into the signal you need to make decisions. Use them to understand progress, spot bottlenecks, and compare performance.
Reports are for **decisions, not just data**. Skim quickly, then drill into the section that highlights a problem.
## When to use Reports
Use Reports when you need to:
* Understand **hiring progress**
* Identify **delays or bottlenecks**
* Compare performance across **jobs, candidates, or recruiters**
## Open Reports
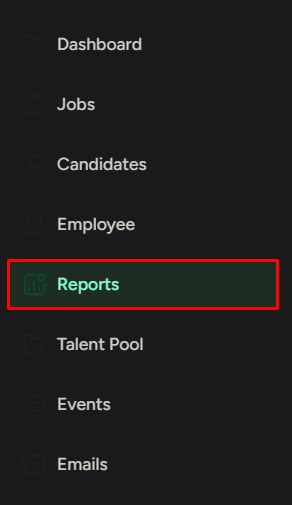
Click **Reports** in the left menu. The default view opens **Job Reports**—a high-level view of hiring performance.
 ## Report sections
Reports are split into three tabs.
Job performance, hiring progress, and department-level hiring.
Candidate flow, drop-offs, and conversion from application to hire.
Recruiter performance, efficiency, and contribution to hires.
### When to open each tab
| Tab | Use when |
| -------------- | ---------------------------------------------------------------------- |
| **Jobs** | You want to identify which jobs are progressing and which are delayed. |
| **Candidates** | You want to find where candidates are dropping off. |
| **Recruiter** | You want to compare recruiter performance and spot gaps. |
## Date range
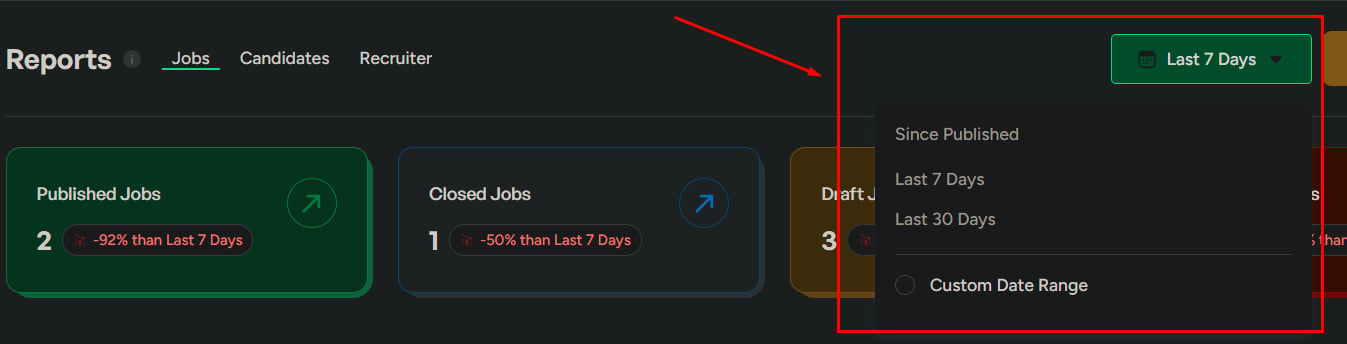
Every report respects a date range. Pick the window that matches your question.
Short-term tracking and recent activity.
General performance view and monthly trends.
Detailed analysis across quarters, campaigns, or hiring drives.
**Always check the date range** before analyzing any report. The same metric can tell completely different stories across 7 vs 90 days.
## Report sections
Reports are split into three tabs.
Job performance, hiring progress, and department-level hiring.
Candidate flow, drop-offs, and conversion from application to hire.
Recruiter performance, efficiency, and contribution to hires.
### When to open each tab
| Tab | Use when |
| -------------- | ---------------------------------------------------------------------- |
| **Jobs** | You want to identify which jobs are progressing and which are delayed. |
| **Candidates** | You want to find where candidates are dropping off. |
| **Recruiter** | You want to compare recruiter performance and spot gaps. |
## Date range
Every report respects a date range. Pick the window that matches your question.
Short-term tracking and recent activity.
General performance view and monthly trends.
Detailed analysis across quarters, campaigns, or hiring drives.
**Always check the date range** before analyzing any report. The same metric can tell completely different stories across 7 vs 90 days.
 ## Export reports
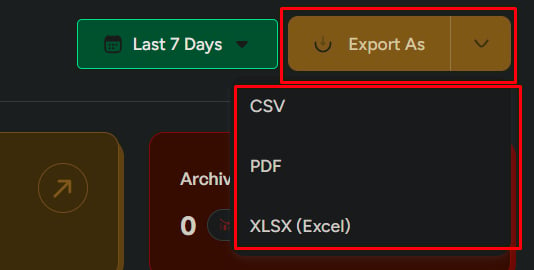
When you need to share or analyze data outside the system:
* Export as **CSV**, **PDF**, or **XLSX**
* Export a specific report, or **export all sections**
* Export **only what you need** to avoid noise
## Export reports
When you need to share or analyze data outside the system:
* Export as **CSV**, **PDF**, or **XLSX**
* Export a specific report, or **export all sections**
* Export **only what you need** to avoid noise
 ## Related
Drill into job performance and hiring distribution.
Find at what stage candidates drop off in the pipeline.
Measure recruiter contribution and efficiency.
## Related
Drill into job performance and hiring distribution.
Find at what stage candidates drop off in the pipeline.
Measure recruiter contribution and efficiency.